
Guest Post by New England Clean Energy Customer Eric Richard
“You cannot manage what you cannot measure… and what gets measured gets done.”
– Bill Hewlett
Mark likes to say his customers become more energy-efficient after installing solar in an effort to zero out their electric bills. That definitely happened to us when New England Clean Energy installed a pole-mounted system at our last home.
By the time I asked Mark and his team to install a 10-kilowatt system at our new home, I was hungry for detailed data to help decrease my energy use. After all, if you can’t accurately measure your energy usage, how can you manage and reduce it?
I had a Powerhouse Dynamics eMonitor [now called SiteSage for Homes] installed to measure my energy usage and production in real-time through a slick web-based interface.
The solar itself came with Solrenview system monitoring, which provides real-time production data but no energy usage data. On the other hand, eMonitor reports real-time solar production and electricity use on a circuit-by-circuit level. You can see online how much energy is being used by your refrigerator vs. your furnace vs. your home entertainment system vs. your lights.
Installation took about 5 hours. An electrician puts a monitor on every circuit breaker and carefully labels what each circuit is for. I spent 30 minutes typing circuit information into the web interface. Then, I let the system shine.
Immediately, I saw a whole new view of our energy consumption. Within minutes, we identified issues including these:
One of our basement lights was creating a surprisingly large load. In theory, all my basement lights had low-wattage CFLs. But, when I checked every bulb, I found one incandescent. We switched that to a CFL and the load dropped. I have since replaced all the bulbs with LEDs to reduce the load even more.
The next super easy discovery was an unusually high load coming off some unused outlets. We found two transformers plugged in and sapping energy even though the devices they were connected to were turned off.
The radiant heat under our tile floors was using more energy than we realized. We turned it off in unused rooms and lowered the thermostat setting in others.
In case you were wondering, yes, the system even reports on its own usage, which comes in at a minuscule 3 watts.
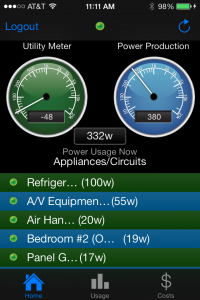
The web interface provides real-time and historical data, and an iPhone app lets you remotely view real-time usage and production. (In this screenshot from my phone, you can see my solar output at that second was 380 watts and I was using 332 watts so 48 watts were being sent back to the electrical grid.)
The main downside of eMonitor is the cost. The units themselves are not terribly cheap. Then there are fees to use the website and interface with your renewable energy sources. It is incredibly valuable on initial setup, identifying the energy drains you didn’t know about, but the value diminishes after that.
I would rather use the solar energy I generate than send it back to the grid for credit because my municipal light department does not credit at full retail value. By improving my energy efficiency, eMonitor helps my solar cover a greater percentage of my load, and helps me get the most from my solar.
Post-holiday post-script: In December, our Christmas tree lights were the 4th highest user of electricity behind our heat pump, furnace, and a radiant heat floor. At 310 watts, it’s a relatively small part of our overall electricity use, but still, interesting how high it was on the list. Before next Christmas season, I’m going to investigate whether I can get different lights to reduce my usage.
If you liked this article, you might also enjoy:


No comments yet. You should be kind and add one!
The comments are closed.