
Ways to pay for solar electric systems have increased along with solar’s popularity. It can get confusing, so here’s my attempt to make sense of the different ownership models. We offer/work with all these options, so I am not pushing one over another. The right model is the one that works with your financial means and goals.
In the old days (about 3 years ago…), solar buyers needed cash – their own or a bank’s — to purchase a system. Then, new financing options emerged for people who couldn’t or didn’t want to invest that much upfront — enter the lease and PPA (Power Purchase Agreement). But then people said, “I don’t want to lose the financial benefits of ownership.” So new options like the Clean Energy Combo Loan were created, helping people go solar with no money down while providing all the financial benefits of ownership.
The graphs below show the total 20-year financial impact of various ownership models. By this, I mean they show how much you spend and/or how much you save or earn, based on a 6,540-watt system with high-efficiency panels. (I used a real-life customer estimate for this analysis. See the end for assumptions used in my calculations.)
Let’s have a look at the first graph. The numbers across the top are years; the numbers down the left side are dollars. The line at the top represents $0 and everything under that line is total money spent over time.
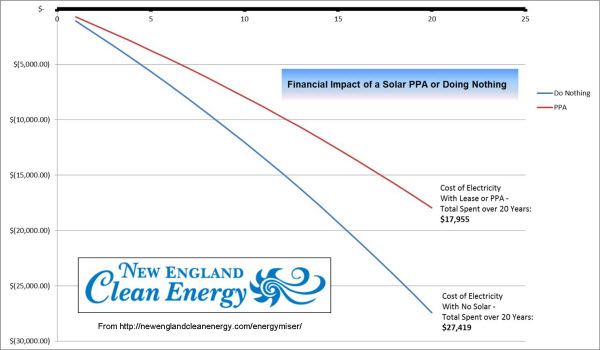
The blue line is the baseline – what you will spend on electricity, in total, if you do not install solar and continue to buy all your power from your electric company – more than $27,000 over 20 years based on today’s prices and a conservative inflation rate.
The red line represents a Power Purchase Agreement (PPA), which is like a lease. A third party owns the panels on your roof; you buy the electricity from those panels at a lower price than the electric company’s. The PPA requires no upfront investment, and provides slow but steady electricity savings compared to doing nothing. In the end, you pay about $18,000 over 20 years, compared to $27,000 if you do nothing, saving yourself $9,000.
Now we need a second graph, because the other three scenarios involve making money as well as spending money. In addition to saving on electricity like you do with a PPA, you get money from federal and state tax credits, a state rebate and selling SRECs.
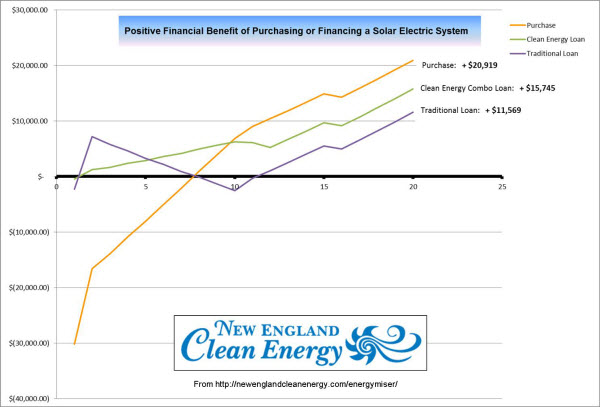
The orange line shows the “purchase” scenario, if you are lucky enough to have your own money available to buy solar. Upfront you make a large investment of about $31,000 (below the line), which is paid back over time through savings and earnings. Purchasing outright is clearly the greatest value of all. If you add up your solar-related “income” — the tax credits, state rebate, SREC income, and electricity savings; then deduct the cost of your solar electric system and whatever small amount you paid for electricity from your utility over 20 years, your net benefit is more than $20,000.
(The small dip around Year 16 in all three scenarios represents the probable expense of replacing the inverter.)
The green line shows the Clean Energy Combo Loan. The total of your electricity savings plus SREC income is greater than the monthly loan payment, so this option is “cash positive” from Day 1 – it never dips below the line. Put another way, you will own the solar system on your roof, and have more money in your pocket every month than you would have without the solar system. The 12-month Same-As-Cash feature fronts you the amount of the federal tax credit until it comes in. SREC sales end in Year 11, hence the small dip there. When the loan is paid off in Year 12, you continue to “make” money in the form of electricity savings. Net benefit over 20 years? More than $15,000.
The purple line shows what happens if you use a traditional bank loan to pay for solar. Other than an initial deposit, you are not out any money upfront. The spike you see at the end of Year 1 is your federal and state tax credits coming in, worth 30% of the total system cost. After that, your loan and interest payments are more than your electricity savings and SREC income, so the line trends downward, until about Year 10 when the loan is paid off. At that time, the real financial benefits kick in. At the end of 20 years, you have a net positive financial benefit of more than $11,000.
Notice where the orange “Purchase” line intersects the $0 line, in Year 7. This is the “break-even point” at which the money you’ve invested is matched by the money you’ve saved/earned. From that point on, every dollar you make or kilowatt-hour you generate is pure profit. Break-even takes a little longer with a traditional bank loan, because you are paying interest on the loan.
I hope this post gives you some sense of how the different options work. In all cases, you end up spending less on electricity if you install solar than if you did nothing at all. In the Purchase and two Loan cases, you spend less on electricity and earn money. It’s just a question of how much.
Assumptions Installation is in Massachusetts and homeowner gets a utility rebate, state and federal tax credits. System is 6,540 watts comprised of 20 SunPower 327-watt panels and 1 Solectria PVI-6500-240V string inverter. Roof 87% of ideal. Annual production estimate 7,681 kWh. Electricity prices start at $0.14/kWh, inflating at 3.1% annually. Electricity usage is 6,688 kWh/year. Panel performance degrades at 0.6% per year. First-year electricity savings are $1,075 (annual savings increase as electricity prices rise), and annual SREC income is $1,702 (except in PPA option, which includes electricity savings but no other financial benefits). SRECs sell at $230 each. Clean Energy Combo Loan has a 12-Month Same-As-Cash period, and a 12-year loan at 2.99% interest rate which is triggered by the system being turned on. Standard loan is for 10 years at 4.95% interest rate. PPA cost per kWh is $0.09 with 2.99% escalator.) If you liked this article, you might also enjoy:- Happy House-Hunting?
- Are Solar Leasing Companies Gouging the Market?
- Is A Solar Lease an Asset or Liability When Selling Your Home?


No comments yet. You should be kind and add one!
The comments are closed.