I’m back from our holiday break, with lots to write about, and more guest posts from our customers coming your way.
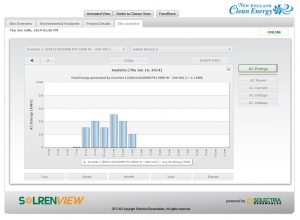
Today, I ask you: Are you obsessed with monitoring your solar electric panels’ performance online, on a daily, hourly or even more frequent basis? It’s a common affliction with many solar owners, particularly new ones. And many of us prefer to think of it as a passion or hobby rather than an affliction.
Call it what you will, but if your spouse is complaining that you spend more time monitoring your solar than talking to him/her, you may have crossed the line into obsession. Ditto if you’d rather watch the sun slowly cross your array of panels than go out with your friends. If work or sleep is suffering, you’re really in trouble.
Believe me, I understand the attraction of watching solar work in real-time, and comparing the performance of strings, rows or even individual panels. But let me try to convince you that you should focus on the big picture, not the hour-by-hour, day-by-day, panel-by-panel fluctuations in your solar output. Your family and friends will thank me.
The wattage or “nameplate” rating assigned to your solar panels is based on standardized testing. But, even if two panels have the same rating, their output can vary quite widely. Why?
Manufacturing – First, there are natural variations in the output of silicon wafers. It is impossible to make thousands of panels that all produce exactly the same watts, despite the same underlying technology. Let’s say a manufacturer aims to produce a panel with output between 245 and 255 watts. Any panels that fall in the range of 245 to 249.9 are put into a 245-watt bin and sold as 245-watt panels. Panels from 250 to 254.9 are put into a 250-watt bin and sold as 250-watt panels. So your 250-watt panel might be capable of producing 250 watts or 251 or even 254.
Real World Operation – Second, a number of real-life factors affect panel output:
- Temperature: Colder panels produce more energy than warmer panels.
- Light: The brighter the light, the more energy you get. (No brainer, I know.)
- Shading: Adjacent panels can have quite different amounts of shade on them.
- Heading (azimuth): Panels facing true south generally produce more power (in the northern hemisphere).
- Tilt: The angle of your roof/panels affects output.
- Weather & Seasons: Haze, clouds, snow, etc. obviously reduce solar output. Shorter winter days mean fewer hours of sunlight.
- Wiring: Some line loss is inevitable as electrical energy travels from your panels to the inverter where it is measured.
- Inverter: Manufacturing variability in inverters (yes, even micro-inverters) affects production. Not all resistors, capacitors and inductors are identical.
Given this variability in manufacturing and real-world conditions, each individual panel on your roof cannot perform exactly the same as its neighbor. Think of them like kids. I have triplets, and I gave up expecting the same behaviors from them ages ago.
This inherent variability is why New England Clean Energy sells systems, not individual panels, and gives you production estimates based on annual averages that factor in all the potential losses listed above.
What really matters is the energy produced over time. While comparing individual panel performance in real-time may be educational and fun, watching the entire system’s performance over time is where the money is.
If you liked this article, you might also enjoy:


