
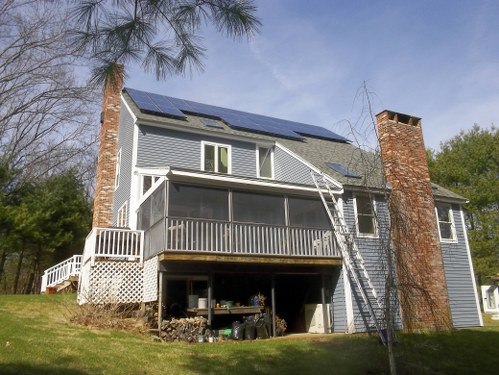
 You’re the proud owner of a new 7,800-watt solar energy system. But every time you check your online monitoring, your system is operating below the full 7,800 watts of capacity.
Then you notice the rating plate on your inverter in the basement says 7,600 watts. What the heck?
I can explain the perfectly legitimate reasons for the discrepancy, but first, I have to go off on a tangent and discuss solar panel testing.
Standard Test Conditions (STC)
A solar panel is first tested right in the factory. As the panel comes off the production line, a worker (or robot) places the panel on a “flash table” and hooks up the positive and negative leads to a measuring device. The panel is then “flashed” with fake sunlight. The connected electronics record a number of performance values including the panel’s voltage (volts), current (amps) and power (watts).
 These testing conditions are called “Standard Test Conditions” or STC. But what’s standard about them? Well, the light source is calibrated to a defined set of wavelengths and so that precisely 1,000 watts per square meter fall on the front glass of the solar panel. Temperature is the other key test condition – everything is at 77°F (25°C). The solar cells, glass, aluminum frame, and back-sheet are all at 77°F.
If you haven’t noticed already, these test conditions are nothing like the real world. So why does the manufacturer even bother?
As it turns out, there is quite a bit of natural variation – upwards of 5-6% – in the power output from solar cells and panels, even from panels made in the same production run. The manufacturer uses STC testing to sort panels by power and ensure that similar panels are sold and used together.
For example, let’s say that after a flash test, a panel measures out at 257 watts. The manufacturer will “bin” that panel in the “255 to 259.9 watt” bin. A 263.4 watt panel will end up in the “260 to 264.9 watt” bin and so on. The manufacturer will then sell the 255-259.9 watt panels as 255-watt panels, and the 260 to 264.9-watt panels as 260-watt panels. (By the way, even though the panels come off the same production line and cost exactly the same to manufacture, manufacturers charge more for the higher wattage panels.)
Unfortunately, this testing gives only a rough indication of how solar panels will perform in the real world. That’s where the next test comes in.
PVUSA Test Conditions (PTC)
In the mid-1990s, under the direction of the National Renewable Energy Laboratory (NREL), a set of test conditions were developed to measure solar panel performance under “real world” conditions. The conditions were called “Photovoltaics for Utility Scale Applications Test Conditions” or PVUSA Test Conditions; more commonly “PTC.”
The primary difference between STC and PTC is temperature. If you recall, under STC conditions, everything is at 77°F (25°C).
 Under PTC, everything is heated up as if it were in the sun. The solar cells within the panel are raised to their “normal operating cell temperature” which is typically around 113°F (45°C). The ambient temperature is set to 68°F (20°C), and a 2.2 mph (~1 meter/second) breeze blows across the panel. Here is a summary of the two sets of test conditions:
| STC | PTC | |
Solar Cell Temperature | 77°F (25°C) | 113°F (45°C) |
| Ambient Temperature | 77°F (25°C) | 68°F (20°C) |
| “Cooling” wind speed | None | 2.2 mph (1 m/s) |
Because of the physics of solar panels, as they heat up, the voltage they can produce goes down. And since the electrical Power (watts) = Voltage x Current, when the voltage goes down, the power goes down.
How are PTC ratings used? For us installers, the PTC “real world” rating helps us design and sell appropriately sized systems, and to more accurately predict their performance. For panel manufacturers looking to sell panels in California (so basically all manufacturers, since CA is the largest solar market in the U.S.), you have to submit your panels to the California Energy Commission (CEC) for testing. What test conditions does the CEC use? PTC.
You can find PTC test results at GoSolarCalifornia, but the list is nearly 16,000 panels long and the table download takes a while. Here’s a sample of the table for a panel we’ve used:
![]()
What does this all mean?
As you can see, the Canadian Solar 260-watt Polycrystalline Module has a PTC rating of 239.1-watts and an STC rating of 260 watts. As the panel heats up, as they all do in the real world, its output drops. (And as panels cool, their output goes up!)
This type of power drop-off happens for ALL panels. The percentage drop off, however, varies greatly by panel type, materials used, and manufacturer. For example, SunPower panels, which we use almost exclusively, drop by about 6%. Most non-SunPower panels drop 8-10% and the CEC data shows panels that drop as much as 16.5% under PTC testing – or to put it another way, the panel’s PTC rating is 83.5% of its STC rating.
If you are thinking, “that means not all panels are the same,” you are correct. For sake of comparison, I pulled every panel from the GoSolarCalifornia table with an STC rating of 260 watts – all 655 of them. Their PTC ratings varied from 217.1 watts (PTC/STC=0.835) to 239.8 watts (PTC/STC =0.922).The Canadian Solar panel referenced above is at the high end of the scale (PTC/STC=0.919)
It’s important to note what the PTC testing reveals – not all panels with the same STC rating perform the same. From my quick analysis above, there is a 23 watt (~9%) performance difference between the best and worst performing “260-watt” panels tested by the CEC.
What Your System Will Produce
So, back to where we started. Imagine you purchased a 7,800-watt system. If your panels could operate at STC – everything at 77°F all the time – your system might actually run at 7,800 watts of capacity at some point in time. But in the real world, the panels will run much hotter (even on a cold day), and the power will drop significantly. The PTC analysis tells us that even under modest heating, the system’s output will be about 8-10% below the STC rating. If we take the specific case of the Canadian Solar panel, with PTC of 239.1, your 7,800-watt array can, at most, run at about 7,173 watts.
As for your inverter, suddenly it’s clear that a 7,600-watt inverter will be just fine.
If you read this and think you got ripped off because you paid for a 7,800-watt system, it helps to know that what you actually paid for was a system that would produce a certain number of kilowatt-hours over some defined period of time.
The economics of a solar energy system are based on its energy production, not its watts. Energy production is a function of the panel performance, as we’ve been discussing, along with weather, roof pitch, roof heading and shade. When we calculate your production estimate, which is the foundation of your solar system’s economics and your production warranty, we account for all of these factors.
 Download our 7 FAQs
If you liked this article, you might also enjoy:
- What’s in an American Solar Panel?
- What’s in a Solar Production Estimate?
- Are All Solar Panels the Same? The Constantly Evolving World of Solar Panel Manufacturing – Part II