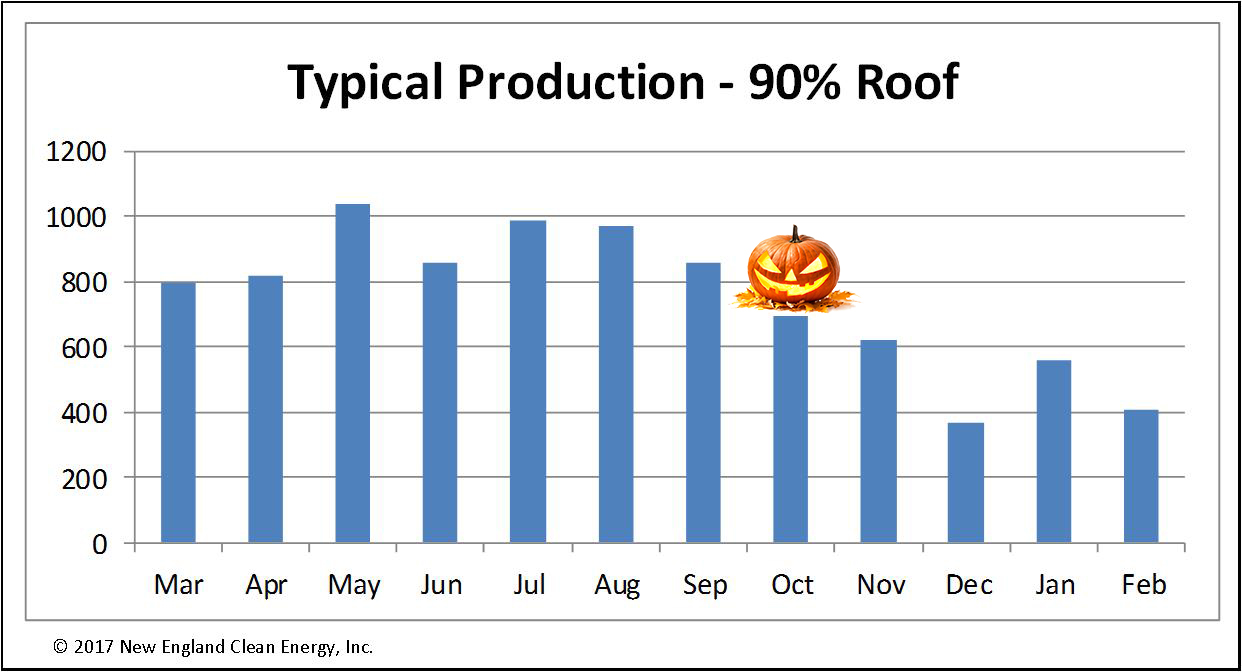
If your solar energy system was turned on between March and September, and most are, because that’s more than half the year, then you may be horrified when your October production drops. Don’t be. It’s typical to see strong production for seven solid months preceding October and then boom – your solar monitoring site tells you your output is at a new low. Then the number drops again in November, and again in December.
It’s not unusual for solar production to decrease 20% – 35% between September and October, as this customer’s monthly production chart shows.
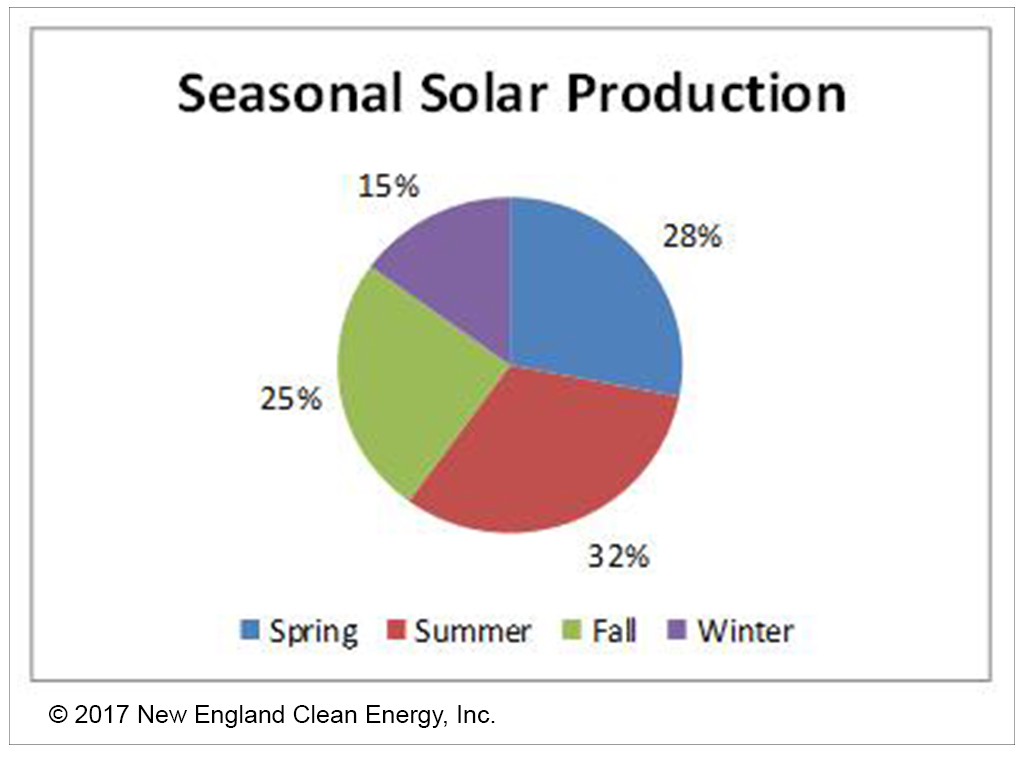
Seasonal Solar Production Variations
Not surprisingly, most solar systems generate ~60% of their annual production in the warm months.
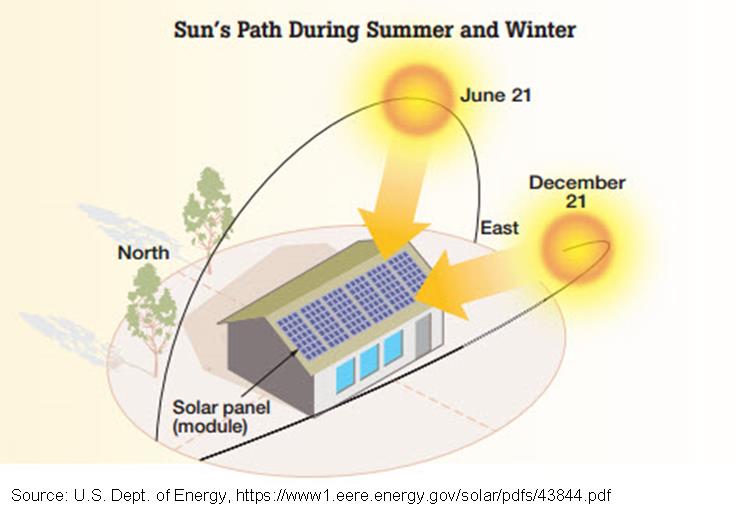
Technically, panels operate more efficiently in cooler weather so they love cold New England winters. But, we get fewer daylight hours of solar production. The winter sun is lower in the sky, changing the angle at which it hits your panels and increasing shade from nearby trees. Even deciduous trees without their leaves can greatly impact winter production. And that all assumes it’s not cloudy, foggy or snowing, and the panels aren’t snow-covered.
By season, production generally goes something like this. For the purposes of this chart, I divided the year into four, three-month-long seasons – so Spring is March, April, May — even though we know winter lasts for what feels like eight or nine months in New England. 🙂
Anomalies
Will the trends I’ve laid out hold true every year? Of course not. This is New England after all, where every year is different – heck, every day is different — and the weather throws wrenches in our best laid plans all the time.
The worst example of this in recent history was the winter of 2015, affectionately known at New England Clean Energy as the Worst Winter Ever. February saw record-breaking snowfall and cold, so several feet of snow sat on rooftops for a long time. All of us solar owners saw production that month at a mere 35% of a more typical February’s production. Imagine how rough that was for the people who turned on their systems that month, and we had quite a few!
But overall, you’d be surprised by how little variation there is in production year to year. Even with one horrible month or two iffy months in the mix, most solar owners meet their annual production targets.
As long as your production is following the general seasonal patterns shown in the graphs above, and is generally consistent with the kWh we said you’d get in your proposal, don’t worry. If your production isn’t consistent with those benchmarks, give us a call or email at Service@NewEnglandCleanEnergy.com. And remember, our Performance Warranty will keep you whole if your system does under-perform.
If you liked this article, you might also enjoy:
- What’s in a Solar Production Estimate?
- Solar Makes Sense, Even in Snowy Climates
- Is Monitoring Your Solar Panels Taking Over Your Life?
